Company Profile
Company Overview
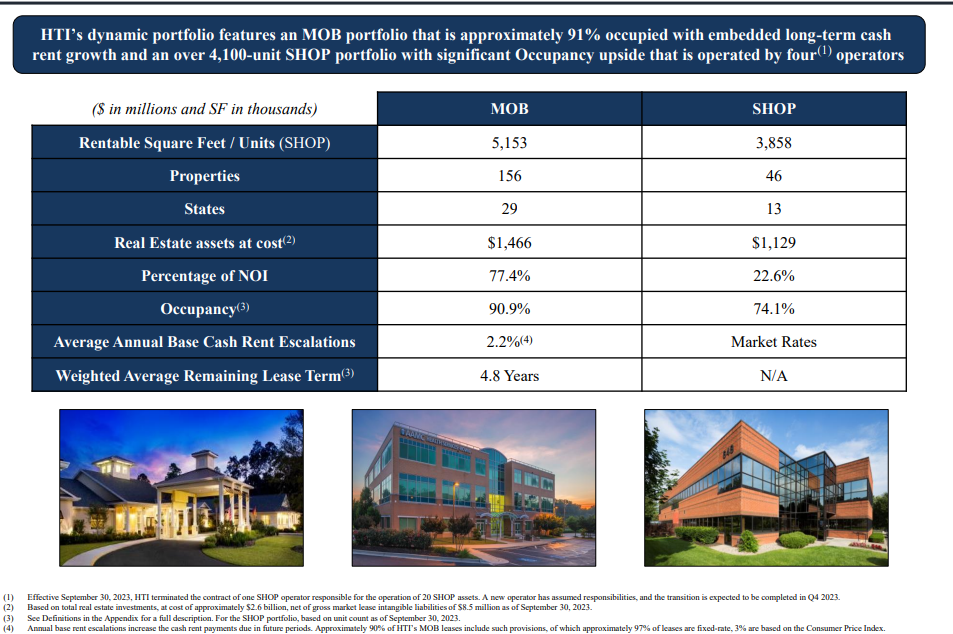
Portfolio Snapshot
Dynamic Portfolio Fundamentals
Forward-looking Statements
Leadership
Leadership Team
SHOP Team
Board of Directors
Portfolio
Investor Relations
SEC Filings
Forms
Corporate Governance
Contact Us
Tenant Resources ▼
Leasing Inquiries
Portfolio Snapshot
Company Profile
Company Overview
Portfolio Snapshot
Dynamic Portfolio Fundamentals
Forward-looking Statements
Portfolio Snapshot
We believe that several demographic, economic and industry-related factors have converged to create an ideal opportunity to generate value through strategic investments in healthcare-related real estate.